User Guide
PingIsKing watches hosts, DNS names and web services, records how they respond, and tells you when something goes down, slows down or changes. This guide explains the app from a user's point of view.
What PingIsKing does
You give it a list of targets. Each target is checked at its own interval, from the machine PingIsKing runs on. Every result is stored, so you get the current state, a history you can chart, and a log of every change of state.
- Monitor: ICMP ping, DNS resolution, and HTTP/HTTPS including certificate expiry.
- Diagnose: each failure gets a cause (for example "connect timeout" or "path breaks in transit").
- Notify: browser push and ntfy, per target, with snooze and mass-outage handling.
- Share: a public page and token-protected custom status pages.
All measurements are taken from one place. A target shown as down is down as seen from the PingIsKing server; the mass-outage banner and the failure cause help you judge whether the problem is local.
Signing in
Open /app and sign in with the username and password you were given.
- Initial password: you must replace it at first sign-in (at least 8 characters). An unused initial password expires after 7 days.
- Invite link: if you received a mail, its link lets you set your own password. The link works once and is valid for 48 hours.
- Lockout: after 5 wrong passwords for a username, sign-in from your address is blocked for 15 minutes.
Your account menu
The chip with your name at the top right holds four small buttons: ✏️ change your display name, 🗝 API tokens, 🔑 change your password, ⏏ sign out.
Install as an app and dark mode
On phones and in Chromium-based browsers, ⬇ in the top bar installs PingIsKing as an app with its own icon; the icon shows the number of offline targets as a badge. 🌙 switches between light and dark.
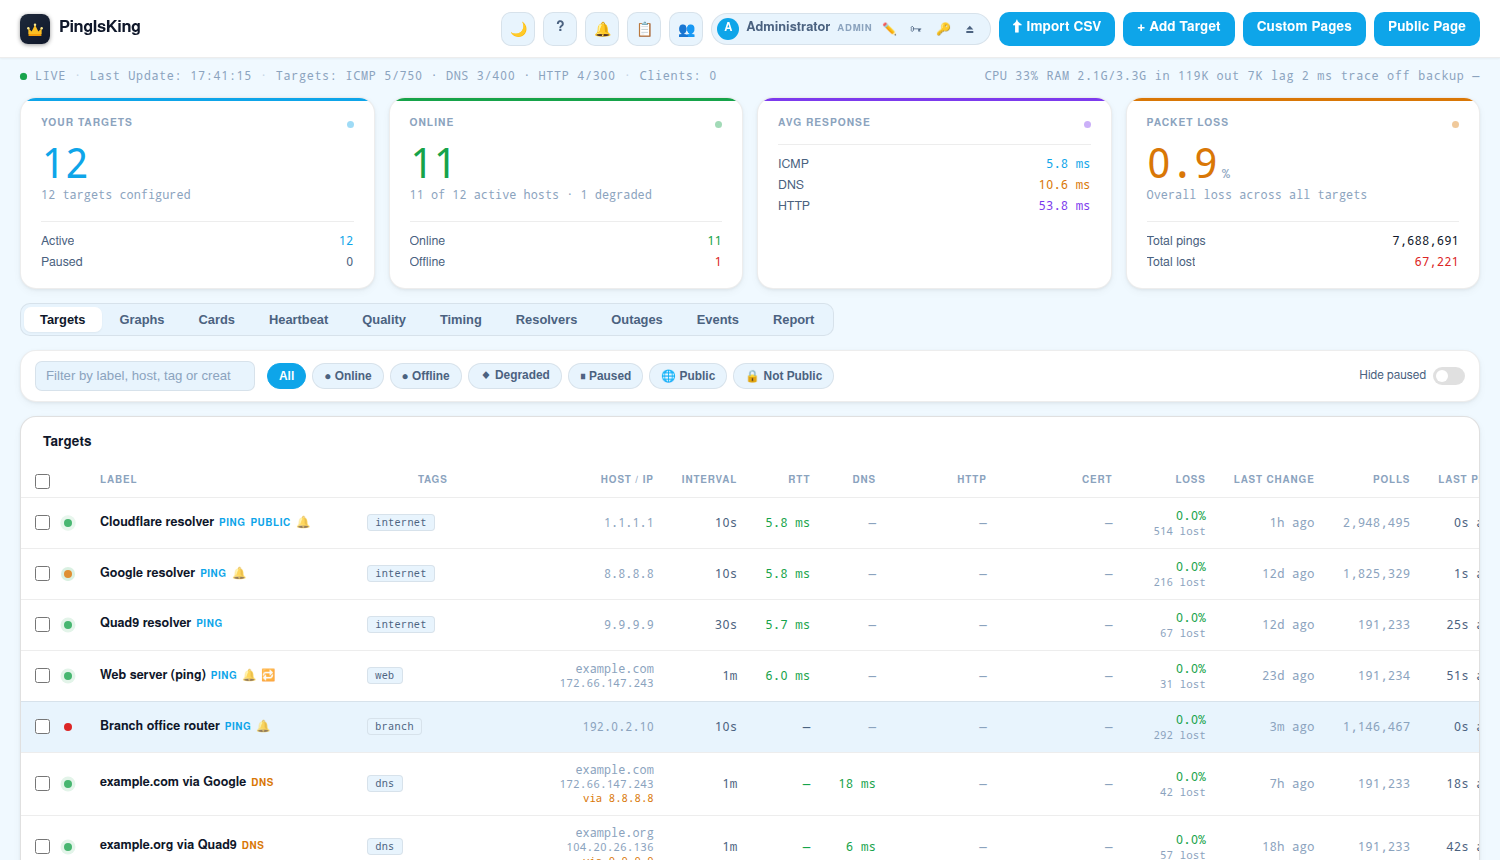
The screen at a glance
| Area | What it shows |
|---|---|
| Top bar | Notifications 🔔, your account, Import CSV, + Add Target, Custom Pages, Public Page. Administrators also see the audit log 📋 and user management 👥. |
| Status line | Live connection state, time of the last update, active targets per type against the limits, and the server's load, including event-loop lag, path-trace level and last backup. |
| Four tiles | Your targets, how many are online (and how many of those are degraded), average response per check type, and overall packet loss. |
| Tabs | Different views of the same targets, see The tabs. |
| Filter bar | A text filter over label, host, tag and creator, plus quick filters: Online, Offline, Degraded, Paused, Public, Not Public, and a "Hide paused" switch. The filter applies to most tabs. |
The page updates live; you never need to reload. If the connection drops, a banner says the data shown is cached.
Check types
| Type | What is checked | Up when | Shortest interval |
|---|---|---|---|
| Ping | Two ICMP echo packets to the host. The faster reply is the RTT; the difference between the two is the jitter. A hostname is resolved first. | At least one packet is answered. | 3 s |
| DNS | One lookup of the hostname, optionally at a DNS server you name. Timeouts are not retried: a lost query is a result. | The name resolves. | 60 s |
| HTTP/S | A GET request, following redirects. Records status code, time per phase (DNS, connect, TLS, first byte) and the certificate's remaining days. | The final status code is below 400, and the body contains your text if you set one. | 60 s |
The longest interval for every type is 3600 seconds. An installation has limits on active targets per type; the status line shows how many are in use.
Adding and editing targets
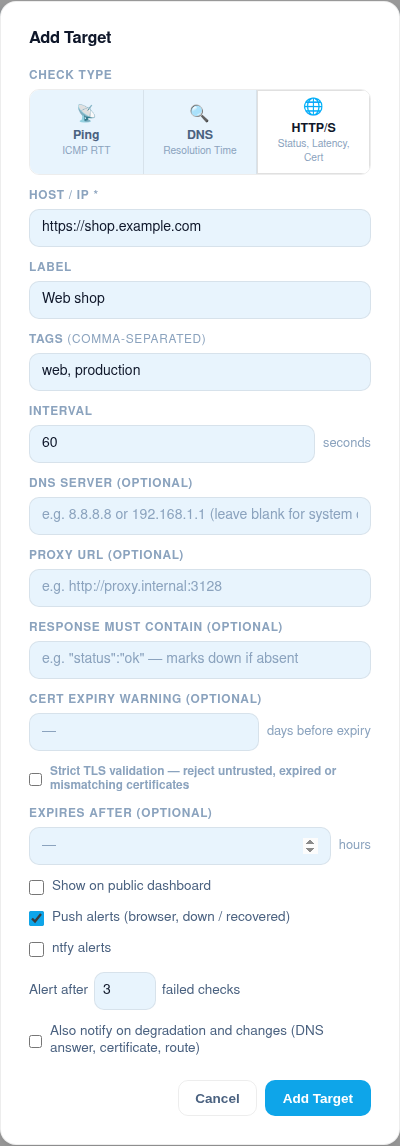
Click + Add Target. Only the host is required.
| Field | Meaning |
|---|---|
| Check type | Ping, DNS or HTTP/S. |
| Host / IP | An address or hostname; for HTTP/S a URL (https:// is assumed if you leave it out).
DNS targets need a hostname. |
| Label | The name shown everywhere. Defaults to the host. |
| Tags | Comma-separated. Use them to filter and to build dynamic status pages. |
| Interval | Seconds between checks. |
| DNS Server | Resolver to ask instead of the system default. |
| Proxy URL | HTTP/S only: send the request through this proxy. |
| Response must contain | HTTP/S only: text the page must contain (case is ignored). If it is missing, the target counts as down with "content mismatch". |
| Cert expiry warning | HTTPS only: notify when the certificate has fewer than this many days left. |
| Strict TLS validation | HTTPS only: treat an untrusted, expired or mismatching certificate as down. Off by default, so self-signed internal services can be monitored. |
| Expires after | Hours after which the target pauses itself. Useful for temporary checks. |
| Show on public dashboard | Lists the target on the public page. |
| Push alerts, ntfy alerts | Turn on notifications for this target, see Notifications. |
In the table, ✏️ opens the same dialog to edit a target (deleting is done from bulk actions), and ⊕ copies it into a new target you can adjust.
Importing from CSV
Import CSV accepts a file or pasted text with one target per line, fields separated by semicolons:
type;host;label;tags;interval;dnsserver;expirehours;public
ping;8.8.8.8;Google DNS;;60;;
dns;example.com;Example DNS;prod,dns;60;1.1.1.1;
http;https://example.com;My Site;prod,web;60;;24;true
typeisping,dnsorhttp; tags are comma-separated inside their column.- A first line starting with
typeis treated as a header and skipped. - A preview shows how many lines are valid and lists the faulty ones before you import.
Reading the Targets table
Status
- Green — the last check succeeded.
- Amber, pulsing — reachable but degraded.
- Red — the last check failed.
- Grey — no result yet. ⏸ marks a paused target, ⏱ a check that is overdue.
Hover the status cell for the diagnosis of the current or the last failure.
Markers next to the label
| Marker | Meaning |
|---|---|
| PING / DNS / HTTP | The check type. |
| PUBLIC | Shown on the public page. |
| 🔔 | Push alerts are on. |
| 🔁 | Also notifies on degradation and changes. |
| 🔕 (status cell) | Notifications for this target are snoozed; hover for the end time. |
| 🔒 (Cert column) | Strict TLS validation is on. |
Columns
Host with resolved address, interval, last RTT, DNS time, HTTP status with response time, certificate validity, loss since the counters were last reset, time of the last state change, number of checks, time of the last check, and who created the target. Many cells show more detail when you hover them.
The detail chart
Click a row to open its chart above the table; ✕ closes it.
- Range: 1h, 6h, 24h, 7d, 30d, 90d, 1y.
- Zoom: mouse wheel or drag a span; hold Shift and drag to move; ⟳ Reset returns to the full range.
- Blue line: response time. Red vertical lines: failed checks.
- Amber line: DNS time, for targets given by hostname.
- Ping targets: a dashed purple line for jitter, and amber dots where one of the two packets was lost.
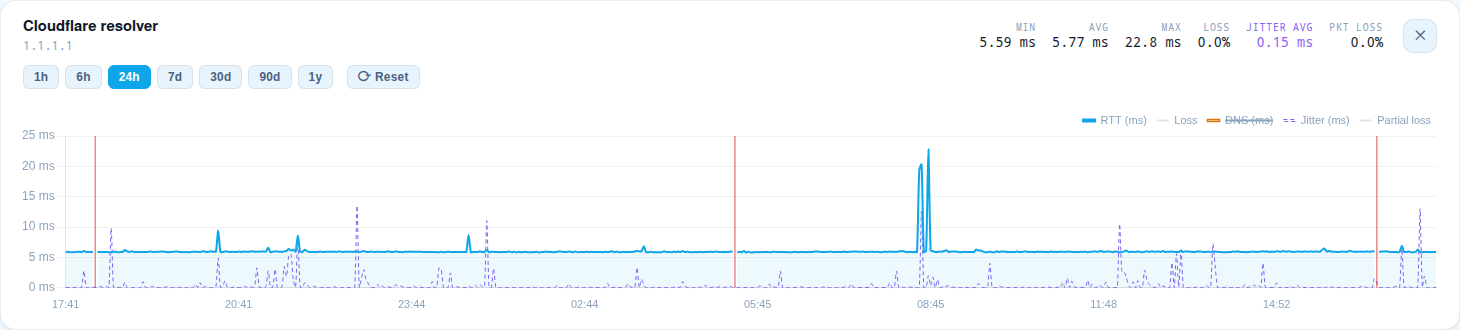
The figures beside the chart (min, average, max, loss, and for ping targets jitter and packet loss) cover the whole selected range, also when the drawn line is thinned for long ranges.
Bulk actions
Tick one or more rows, or the box in the table header to take every row matching the current filter. A bar appears with:
- Pause / Resume checking.
- Make public / private.
- Alerts, ntfy, Changes on or off.
- Snooze / Unsnooze with a duration, see Snoozing.
- Reset counters — clears counts and history of the selected targets; checking continues.
- Delete — removes the targets and their history, after a confirmation.
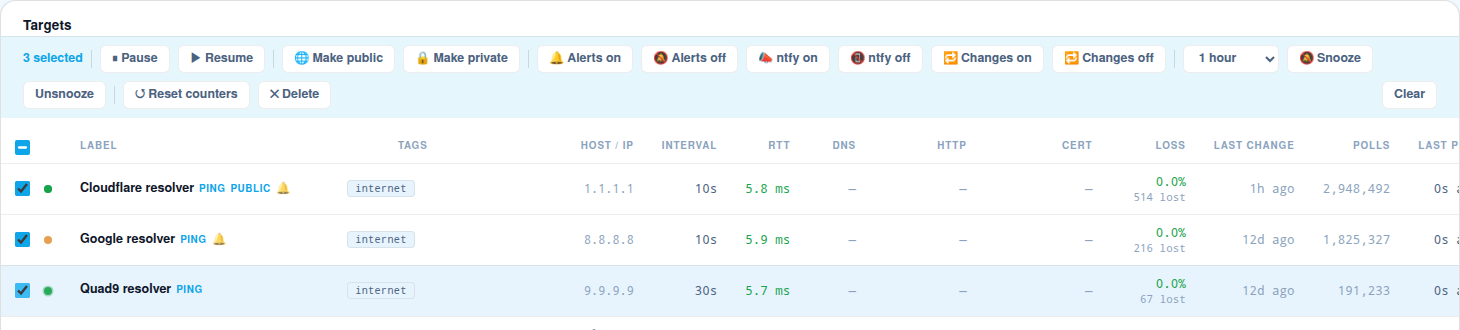
To act on everything with a tag, type the tag in the filter, tick the header box, then choose the action. Rows you may not change have a disabled box.
The tabs
| Tab | Use it to |
|---|---|
| Targets | Work with the list: add, edit, select, open the detail chart. |
| Graphs | See a small chart for every target side by side, with one range for all. |
| Cards | Get a compact status board, one card per target. |
| Heartbeat | See the last 24 hours of every target as a strip of ticks: green all fine, amber partly failed, red all failed, grey no data. Uptime per target is shown beside it. |
| Quality | Rank targets by failed checks, packet loss and jitter over the last 24 hours, worst first. |
| Timing | Compare HTTP targets by phase (DNS, connect, TLS, first byte) over 24h, 7d or 30d; click a row to plot its phases over time. |
| Resolvers | Group DNS targets by the resolver they ask: how many are down, average time, failures and their causes. |
| Outages | Review mass outages of the last 30 days; click one for its events. |
| Events | Read the event log. |
| Report | Generate a report for a period. |
Heartbeat and Quality
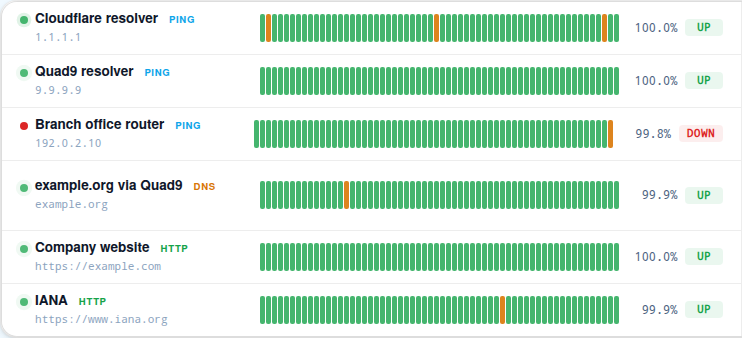
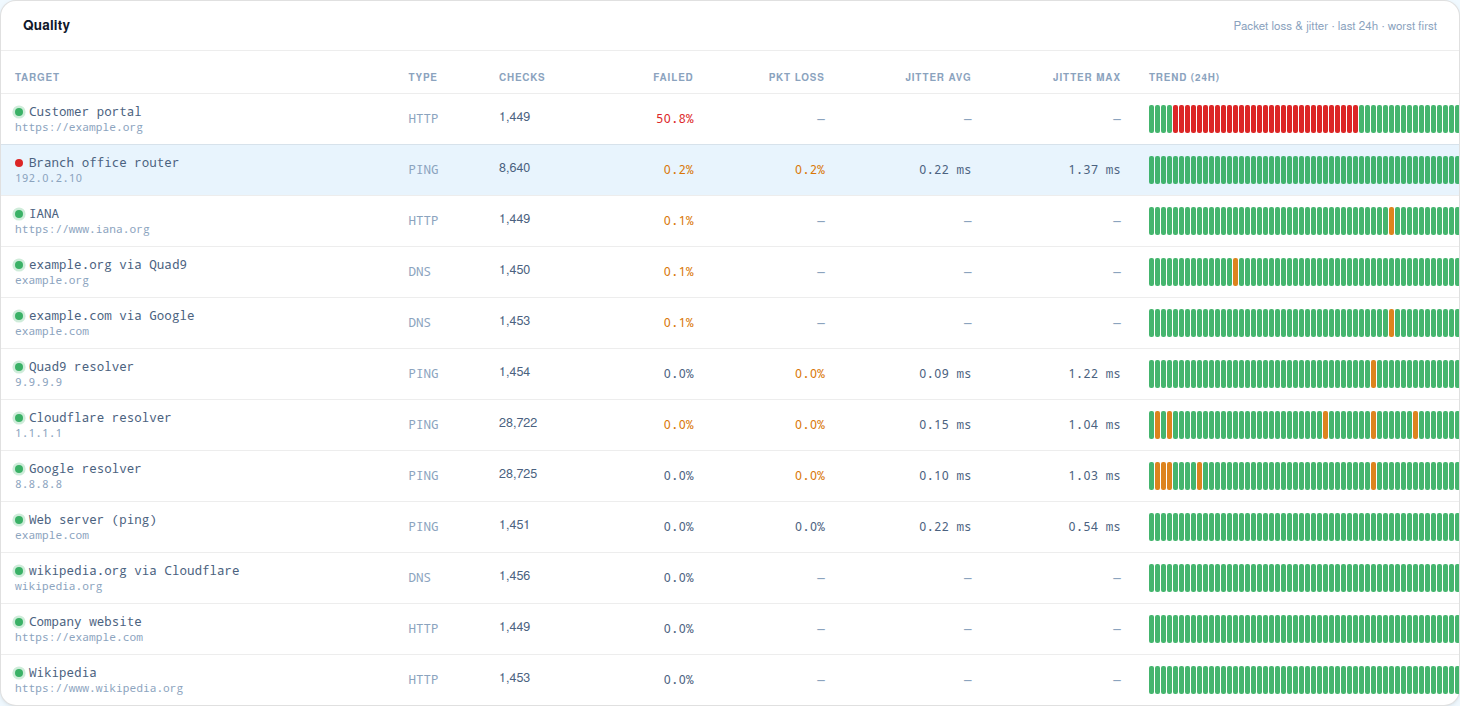
Event log and causes
The Events tab lists every change from the last 30 days: a target going down or coming back up (with how long the previous state lasted), becoming degraded or normal again, and detected changes. Each column has its own filter.
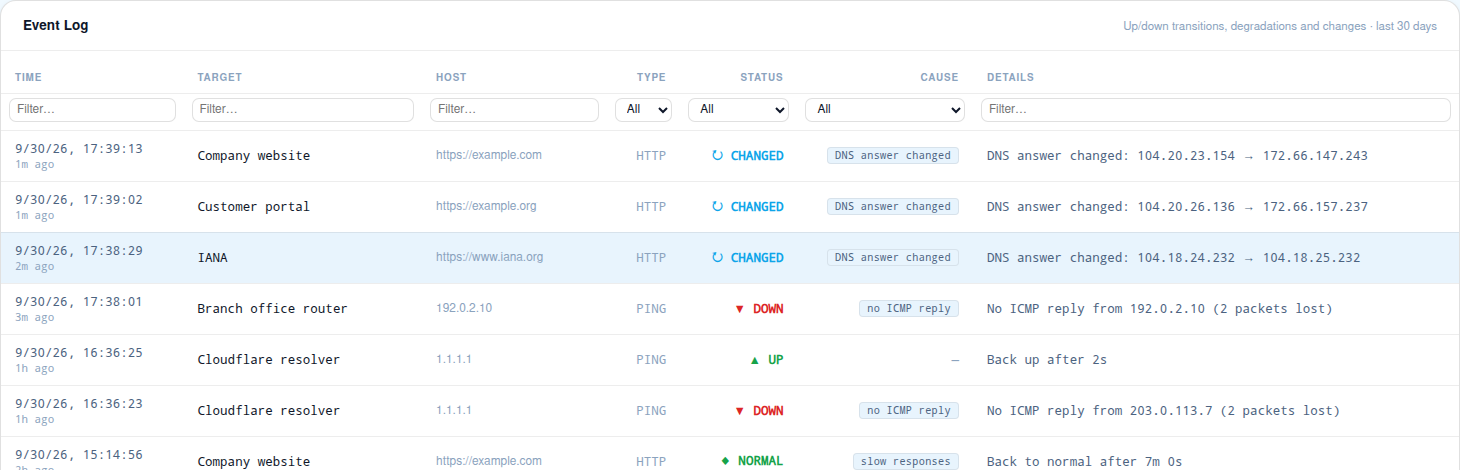
Down events carry a cause. The most common ones:
| Cause | What it means |
|---|---|
| no ICMP reply | Neither ping packet was answered. |
| path breaks locally | A trace ended inside your own network. |
| path breaks in transit | A trace ended at a provider on the way. |
| host silent | The path reaches the destination network, but the host does not answer. |
| ICMP filtered / routing loop | A device on the path rejects the packets, or they circle. |
| NXDOMAIN / NODATA | The name does not exist, or has no address record. |
| single query lost | One DNS query timed out while the resolver answers otherwise. |
| resolver not answering / host down | The DNS server itself is the problem. |
| SERVFAIL… | The resolver reported a failure; the variant says where it arises. |
| connect refused / timeout | The web server's port is closed, or nothing answers the connection attempt. |
| TLS handshake / certificate rejected | Encryption could not be set up, or strict validation refused the certificate. |
| no response | Connected, but no reply within the time limit. |
| HTTP error status | The server answered with an error code. |
| content mismatch | The required text was not in the response. |
Path traces
When a ping target goes down, PingIsKing runs a trace towards it, if tracing is available on the server. The result is added to the diagnosis after "trace:" and sharpens the cause. During a mass outage only the first few targets are traced.
Notifications
Notifications are off by default. Three things must be in place: a channel, a target with alerts switched on, and you being the owner of that target.
Step 1 — set up a channel (🔔 in the top bar)
- Browser push: click Enable on this device and allow notifications. Repeat on every device that should receive alerts (up to 10). Send test checks that it works.
- ntfy: enter the server URL and topic of your ntfy subscription, an access token if the topic needs one, then Save and Send test.
Step 2 — switch alerts on per target
- Push alerts and/or ntfy alerts in the target's edit dialog, or for many at once from the bulk bar.
- Alert after … failed checks (1–10, default 3): the down alert is sent once that many checks in a row have failed.
- ntfy priority (1–5) per target.
- Also notify on degradation and changes — optional, see below.
What you receive
- Down, with check type, number of failures and the diagnosis.
- Recovered, with how long it was down.
- Certificate expiring, if you set a warning threshold.
- A push notification has two buttons: Open and Snooze 1 h.
Alerts go to the owner of a target. Seeing a target, as an operator does for all targets, does not subscribe you to its alerts. Old targets without an owner alert the administrators.
Snoozing
A snooze mutes notifications for a while. Checks, charts and the event log continue unchanged.
- Selected targets: tick them, pick a duration (1 hour to 7 days) in the bulk bar, click 🔕 Snooze. Unsnooze ends it early.
- One target from a notification: the Snooze 1 h button.
- Everything (maintenance): in the 🔔 dialog. Only administrators can set it; everyone sees that it is active, and the bell turns into 🔕.
When a snooze ends, a target that is still down alerts on its next failed check. A target that recovered in the meantime stays quiet.
Mass outages
When many targets go down within 60 seconds, the cause is usually on your own side: the uplink, a resolver, the monitoring host. PingIsKing then opens a mass outage:
- A banner appears at the top of the app.
- You get one notification naming how many of your targets are affected, instead of one per target. Individual down alerts are held while it lasts.
- When most targets are back you get an "over" notification listing what is still down; those targets then alert individually, and you are told as they return.
- The Outages tab keeps the history.
Degradation and changes
Degraded
A target is degraded when it still answers but clearly worse than its own recent past. PingIsKing learns each target's usual response time; nothing needs to be configured.
- Slow: five checks in a row well above the usual time (at least 1.5 times and 10 ms more). Five normal checks in a row end it.
- Lossy (ping): 20 % of packets lost over the last ten checks. It ends at 10 % or less.
- If the slower time lasts, it becomes the new normal after about a day, and the log says so.
Degraded targets show an amber dot, count as online, and appear under the Degraded filter, in the Online tile and on custom status pages.
Changes
PingIsKing logs when a target's DNS answer, TLS certificate or, for ping targets with the option below, network route changes. Names that rotate between several addresses or certificates are recognised and reported once as a pool rather than on every check.
Being notified
Both are always recorded in the event log. To be notified as well, tick Also notify on degradation and changes on the target (it needs push or ntfy alerts on). Change notifications are limited to one per hour per target.
Public page
The address of the installation without /app shows a dashboard that needs no sign-in. It lists
every target marked Show on public dashboard, with status, history and a chart.
The public page shows a target's host name and address to anyone who can reach the server. Use a custom status page if those should stay private.
Custom status pages
Custom Pages in the top bar lets you build pages from a selection of targets and share each by link.
- Click + Add Status Page and give it a name.
- Tick the targets to show, and/or add dynamic rules: a tag rule takes every target with exactly that tag, a name rule every target whose label contains the text. Targets matching any rule join and leave the page automatically.
- Save, then copy the shareable link.
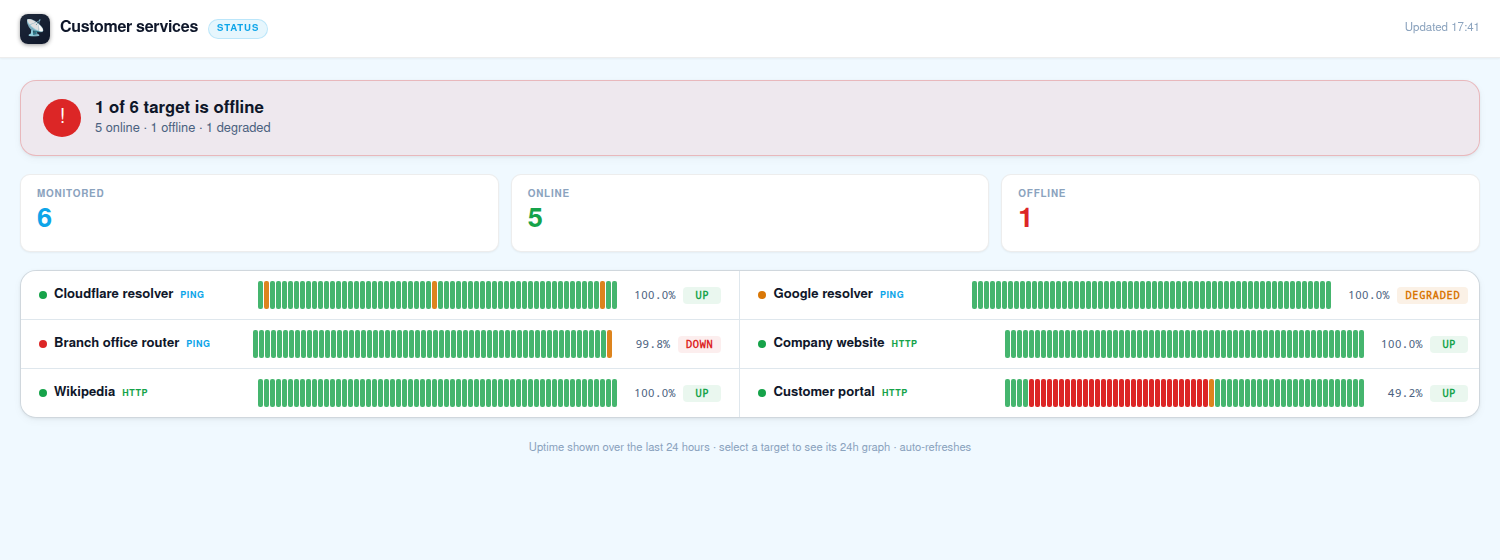
- The page shows label, status, 24-hour heartbeat, uptime and a response-time chart. Host names and addresses are never shown.
- A banner summarises the state: all operational, some degraded, or some offline.
- The link contains a secret token. Anyone with the link can view the page, so share it deliberately; Regenerate makes a new link and invalidates the old one.
- You can have up to 50 pages with up to 500 targets each.
Reports
The Report tab summarises a period (24h, 7d or 30d): availability, outages, slow or lossy targets, certificates and alerts. Click Generate; earlier reports stay in the list.
If the administrator has connected an AI service, the report also contains a written interpretation with findings and recommendations. Each such report costs a small amount, so they are generated only when you ask. Without it you get the figures only.
Roles
| Role | Sees | May change | Administration |
|---|---|---|---|
| User | Own targets | Own targets | — |
| Operator | All targets, fleet-wide reports; custom pages from any target | Own targets | — |
| Admin | All targets | All targets | Users, audit log, backups, maintenance snooze |
Targets created before owners existed belong to nobody; everyone sees them and may change them. Your role is shown next to your name in the top bar.
API tokens
Everything the app shows is available to scripts through the HTTP API. 🗝 in your account menu creates a personal token: give it a name, a scope (read for queries only, write for changes too) and optionally an expiry.
- The token is displayed once. Copy it then; it cannot be shown again.
- Send it as
Authorization: Bearer pik_…. It acts with your account and role. - Revoke a token in the same dialog.
curl -H "Authorization: Bearer pik_…" https://your-server/api/targets
The routes are described in API.md, which comes with the installation.
How long data is kept
| Age | Detail |
|---|---|
| Up to 48 hours | Every single check. |
| Up to 90 days | 5-minute summaries: number of checks and failures, average, minimum and maximum response time, loss and jitter. |
| Up to 2 years | Hourly summaries. |
| Event log | 30 days. |
Summaries keep failures exact: loss percentages over long ranges are computed from the real counts, not from averages.
For administrators
- Users 👥: create users with an invite mail or an initial password, set the role (User, Operator, Admin), reset a password, delete a user. Click a name or mail address to edit it.
- Audit log 📋: who signed in, and who created, changed, snoozed or deleted what, including alerts sent.
- Maintenance snooze: in the 🔔 dialog; mutes all alerts for every user for 1 to 24 hours.
- Backups: made automatically every night; the status line shows the last one.
Installation, settings and optional components (mail, path tracing, AI reports) are covered in install.md.
Troubleshooting
| Symptom | Check |
|---|---|
| No notifications arrive | Is push enabled on this device (🔔)? Is "Push alerts" or "ntfy alerts" ticked on the target? Are you its owner? Is a snooze active (🔕)? Try Send test. |
| The alert comes late | It is sent after "Alert after" failed checks: 3 failures at a 60-second interval is about 3 minutes. |
| Many targets down at once | Look for the mass-outage banner; the problem is probably local. |
| A ping target is down but the service works | The host or a firewall may drop ICMP. Read the trace in the diagnosis, or monitor the service with an HTTP/S check instead. |
| An HTTPS target with a self-signed certificate | Works unless Strict TLS validation is ticked. |
| I cannot edit or tick a row | The target belongs to someone else; operators can see but not change such targets. |
| "Limit reached" when adding or resuming | The installation's limit of active targets for that type is used up. Pause targets you no longer need. |
| The page says it shows cached data | The connection to the server is interrupted; it reconnects by itself. |
| "Too many requests" | Changes are limited per minute. Wait a moment, or use bulk actions and CSV import for many targets. |